What You See When You Actually Test Whether Your Strategy Options Are Really Different
This is the fourth article in a six-part series on structured decision making, where I work through a real, publicly discussed case — Mallorca’s tourism debate — using my Strategic Clarity framework: Frame, Map, Imagine, Design, Decide, Commit. This piece covers Design: building a morphological box of strategy options from the dimensions of choice in Imagine, and checking whether they genuinely differ from each other. Methodology notes and context at the end.
In the last article, I built seven external scenarios for Mallorca’s tourism system: seven different ways the conditions around the island could develop, whether anyone wants them or not. They are neither wishes nor forecasts. They are test conditions, built so that strategic options can later be held against them, and one of them deliberately changes nothing. I also named five dimensions of strategic choice, each tied to a point of leverage the mapping had flagged. I ended on a handoff: the dimensions, not yet their variants, and certainly not yet a strategy. Design now turns those dimensions into a morphological box.
Design picks up exactly there, and it runs into a habit I recognize from many strategy discussions: the shortlist of one. One option gets developed properly, usually the one somebody already believes in. Two more get added so that there is “a choice,” and they tend to be that favorite with a few features removed or turned down. On paper, that’s three options. In substance, it’s one idea in three strengths.
Design’s job is to make that harder to do by accident.
Building the morphological box: from five dimensions to fifteen variants
Each of the five dimensions gets three variants. They are not shades of one idea. They differ in logic.
| Dimension | Variant 1 | Variant 2 | Variant 3 |
|---|---|---|---|
| What a booking is for: how overall visitor volume is steered | No explicit steering, only indirect effect through limits on supply | An explicit cap, renegotiated periodically, as with today’s bed limits | A continuously adjusted, technically enforced mechanism tied to a resource budget |
| How regulation is enforced | Periodic manual inspection | Automated detection, plus a human confirmation step and an appeal route before any sanction | Fully automated detection and sanction |
| How rental capacity is allocated | One rule for the whole island | Quotas per zone, by municipality or neighborhood | Permits or auctions object by object |
| When a policy response triggers | Informal and discretionary | A fixed early-indicator trigger that obliges a review | The same trigger, plus a binding hearing and co-decision step |
| How environmental health is measured | One aggregate traffic-light indicator | Separate accounts per resource: water, coast, soil | Separate accounts per resource and per using sector |
Two choices in that table are worth stating openly. The fully automated variant is legally the riskiest one in the box. I kept it anyway, because a complete space needs its extreme end, whether or not anyone later chooses it. And the fourth dimension is wider than the impulse it came from: that impulse covered how fast a policy response triggers, but not whether the people affected get a say. The original construction named that as a gap itself, so I added it as its own axis rather than carrying it forward quietly.
243 combinations, and why intuition won’t carry them
A morphological box with five dimensions and three variants each holds 243 possible combinations. People tend to underestimate how large that space gets, even with a box this small, and that may be why many teams fall back on experience and gut feeling to pick a few combinations. That is where the biases this series started with come back: anchoring on the option already favored, functional fixedness about what a given mechanism is for, a quiet preference for combinations that feel familiar. Nobody can hold 243 combinations in their head, so the head decides without saying so.
The morphological box method replaces that gut call with a rule. Every variant is rated against every variant of the other four dimensions: ninety pairs, each rated from strongly consistent to strongly contradictory. In Imagine, I tolerated slightly inconsistent pairs, and one scenario was even built that way on purpose. Here the bar is stricter. A scenario happens to you. A strategy package is something you would have to carry out, and friction inside a package you chose is a risk you own.
I counted from the matrix myself. Of the 243 combinations, 198 contain no strongly contradictory pair, and 99 contain no contradictory pair at all. Ninety-nine is still far too many to compare, and the rule doesn’t tell me which ones to develop. Choosing three took judgment. That is exactly why the result has to go through a test afterwards.
Three families, built to be different
Three of those combinations became complete strategy families. Each takes one variant per dimension.
| Dimension | A: Digital fine-tuning | B: Managed continuity | C: Spatial-participatory differentiation |
|---|---|---|---|
| Overall volume | Continuous, technically enforced | Periodic, politically negotiated cap | No direct steering |
| Enforcement | Automated, with human confirmation | Periodic manual inspection | Automated, with human confirmation |
| Rental capacity | Quotas per zone | One island-wide rule | Quotas per zone |
| Policy trigger | Fixed trigger, with co-decision | Informal and discretionary | Fixed trigger, with co-decision |
| Environmental accounts | Per resource and per sector | One aggregate indicator | Per resource |
A treats regulation as a continuously adjusted, data-supported system instead of a periodically negotiated administrative act. Its most distinctive element is one the test run itself called more ambitious than any known reference system: a booking that checks the island’s capacity and closes automatically once a limit is reached.
B stays within today’s instruments and applies them more consistently. Its purpose is the same as that of the “nothing changes” scenario in Imagine: it names the unspoken reference point, so the other two aren’t quietly measured against it.
C doesn’t steer the total number of visitors at all. It steers where tourism takes place and who co-decides, and leans on automated enforcement and zone-specific quotas to do so.
One refinement that is mine, not the software’s
The booking-as-gatekeeper idea in family A started in the test run as a general capacity check. While preparing this series, I looked at what current reporting says about the pressure on the island, and it pointed somewhere the bed count doesn’t show. A word on where this sits: these figures are not part of the mapping from article two. They are new information, and I use them only to sharpen one mechanism, not to argue for how the three families were put together.
The first point is the ceiling itself. In May 2024, the Consell de Mallorca announced it would lower the ceiling on tourist places from 430,000 to 412,000, about 308,000 hotel and 104,000 rental places. As of September 2026, that reduction has not happened: according to an editorial in Última Hora, the Consell now says it will not amend the planning instrument behind it during this term. So the cap on beds still stands where it was. The Consell’s own open-data register is consistent with that picture: as of 7 September 2026, it lists 308,974 active places in licensed accommodation such as hotels, apartment complexes and rural stays, in line with the roughly 308,000 on the hotel side. Individual holiday rentals are not part of that file.
The second point is what a cap on beds does not limit. Across Spain, the average stay in tourist apartments fell by 7.3 percent in July, to 4.8 nights per traveler, while total nights stayed flat (INE, 31 August 2026, provisional). That figure is national, not specific to Mallorca. Shorter stays at constant nights mean more arrivals per bed, and many arrivals bring a transfer or a rental car of their own. The rental fleet swells from about 55,000 vehicles in winter to 90,000 to 100,000 in summer, according to the president of the rental association Aevab, as reported by Última Hora, which notes that no official count exists. Registrations in the rental-car channel in the Balearics rose by about 135 percent in April compared with April 2025, while Spain overall grew by 2.4 percent (consultancy MSI for the rental association Feneval, as reported by Última Hora). The figure covers the Balearics as a whole and includes commercial vehicles. It measures new registrations in a single month, not the size of the fleet, and without absolute numbers it says little about how large the increase was.
Based on that reading, I refined the mechanism to count arrivals per bed instead of capacity in general. The reports show these developments side by side. They don’t prove that shorter stays cause the rise in cars, so this remains a reading, not a finding.
I want to be exact about what this refinement is: my own editorial addition. The software did not evaluate this version. Its risks may point the same way as the original’s, or be sharper, since closures at short notice could hit those who depend on planned bookings even more directly. That is my assessment, not a tested result.
The test: could a reasonable person prefer each one?
A shortlist of one favorite and two weakened copies fails a simple question: could a reasonable person prefer an option for legitimate reasons? If not, it was never an alternative.
A against B passes easily. B is not a weaker A. It is a different bet: on consistent application instead of new mechanisms. Someone could prefer it out of well-founded skepticism toward an untried mechanism, concern about surveillance and data protection, or the view that the administration’s capacity to implement is the real bottleneck, not a lack of instruments.
A against C was the closest call, because they share three of five variants: automated enforcement with human confirmation, zones, and a trigger with co-decision. At first glance, C looks like A minus two building blocks. But what C leaves out is the one element with the strongest tensions in the whole matrix and the least precedent. Choosing C means a different theory of change: decentralization and participation instead of central technology. A reasonable person could prefer it for that reason alone.
B against C differ in four of five dimensions, the largest distance in the set.
So the three families are three theories of change, not one idea in three strengths: central and technical, incremental and institutional, decentralized and participatory.
Each family has a weak spot, and it belongs in the open
It is tempting to present a favored option with its weak spots tucked away. In my experience, weaknesses that were known and not mentioned tend to resurface during implementation as frustration and lost trust. I would rather have them on the table from the start.
A: No known reference system matches this combination, and all five dimensions sit at their most demanding variant at once. It needs data-protection and appeal governance, flagged in the test run under EU data-protection rules, and a working co-decision mechanism. Both exist so far only as concepts.
A booking gate also only counts what is registered. A July 2026 cross-check by the newspaper Mallorcadiario, matching the Consell’s register against Airbnb listings, found about one in six (16.6 percent) of roughly 14,900 active listings with no visible license number, concentrated in Palma and Calvià. A widely cited study puts the share of unlicensed rentals at around 40 percent, which the industry association disputes. The two figures aren’t comparable, and a missing visible number isn’t proof of illegality either, so I don’t treat either as the size of the problem. They show that a gap exists and that its size is unknown, and a mechanism that cannot see unregistered supply cannot cap it.
B: It leaves overall visitor volume, the most central point in the mapping, untouched. And it depends on political will to enforce existing rules consistently, even though a delay between decision and enforcement is already documented in the map.
C: Displacement between zones is documented in academic work but not quantified, and without direct volume steering, the most central driver stays unmanaged. It also needs solid zone-level data and a functioning co-decision mechanism.
A first, rough check against the seven scenarios
Imagine’s seven scenarios exist to be held against exactly this kind of option. Design does a first, deliberately rough pass. Two findings stand out.
First, family B is weak against five of the seven scenarios, most clearly against the comparison anchor, the Black Swan, and the scenario of success without reform. B largely is that continuation, so it cannot offer a way out of it. Its one clear strength is in the decline scenario, where it asks the least of an eroding local authority.
Second, no family is robust everywhere. A relies on a working data infrastructure, which a sudden shock could damage itself. C’s co-decision element is slow under acute pressure. A and C both include binding co-decision, which presupposes working local institutions, the very thing the decline scenario erodes.
Two caveats belong with that. Two of the scenarios, the decline and the technological-leap scenarios, rest on an assumption about competing destinations that I haven’t researched thoroughly yet, so the findings for those two are provisional. And one combination, eroding local authority together with structural change in platforms or in the water-energy link, appears in none of the seven scenarios. None of the three families counts as checked against it.
What doesn’t get smoothed over
The seventh leverage point from Map, giving the environment its own institutional voice, still didn’t become a dimension. The sector accounts in family A come closest, because they make resource use visible per sector. As far as this analysis goes, none of the three gives the environment a formal voice or veto.
The mapping also highlights four leverage points, and the most central driver, overall visitor volume, isn’t among them. I anchored the first dimension to it directly, based on the influence matrix. That gap in the mapping stays open.
What Design hands on is three complete strategy families, each with its logic, its beneficiaries, its burdens and its weak spots stated, plus a first rough picture against seven scenarios. Holding them properly against the goals and the scenarios, and working out what to make of the differences, is the next phase’s work.
A note on this series: This article is a methodological illustration of my Strategic Clarity framework using Mallorca as a case study — not an evaluation of specific political decisions or actors. This case is offered as a discussion prompt and a working example, not as a complete or authoritative account — Mallorca’s tourism system has more dimensions, affected groups, and open questions than any single analysis, however careful, can fully capture. The strategy dimensions, variants and concept families used here come from an internal test run of my own Strategic Clarity software, applied to Mallorca’s tourism debate as a demonstration case. The “arrivals per bed” refinement and the figures on the bed ceiling, stays and rental cars are my own editorial additions, drawn from press reports and official statistics as of September 2026, and were not part of the software’s output. There is no real client behind this analysis, and the “consortium” referenced in this analysis is an assumed, illustrative construct built for testing purposes, not a documented position of any real institution. Individual claims are explicitly flagged internally as either evidence-backed or still-to-be-verified assumptions; I’ve carried that distinction through into this article rather than presenting everything with equal confidence. Parts of the analysis are produced with the support of AI agents and reviewed editorially before publication. My focus remains the wellbeing of the island and all who inhabit it — human and ecological alike — not party politics.
Decision Quality Radar — Status after this article
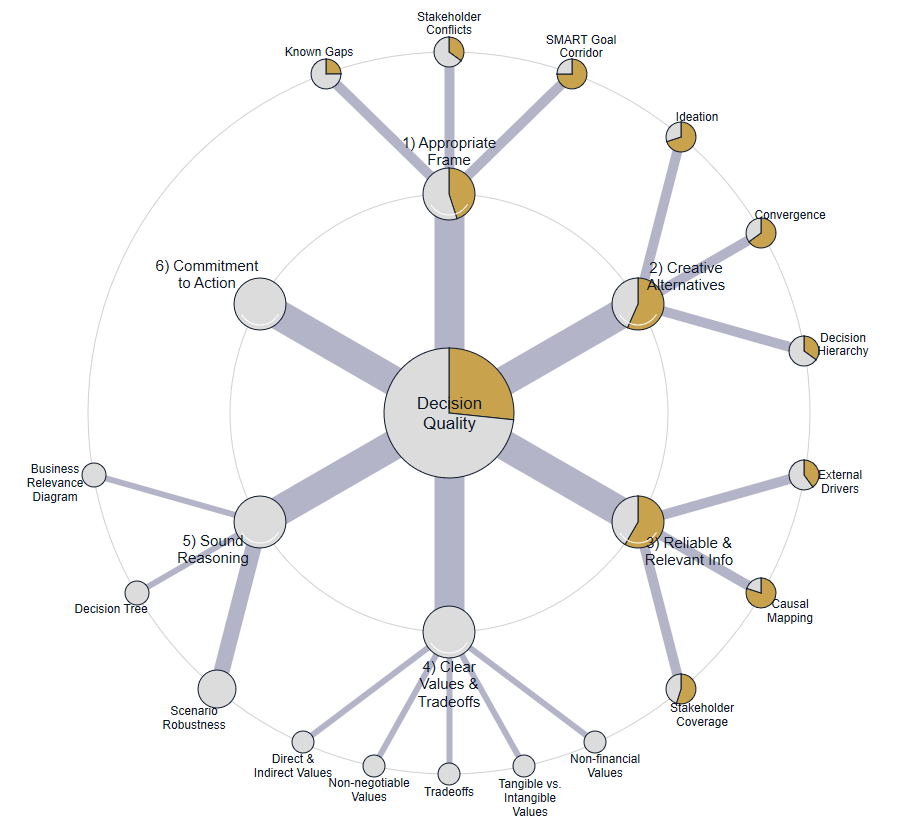
Framing: 2.25/5 (unchanged from Article 1) Information: 2.92/5 (unchanged from Article 2)
Creative Alternatives: 2.83/5 (57%), up from 1.75/5 after Imagine. Both halves of this dimension now have material, so the ceiling of roughly 50 percent that applied after Imagine falls away. Ideation (roughly 70%, up from 45%): the option space was generated systematically, five dimensions with three variants each, including an extreme variant kept for completeness and one dimension widened beyond the impulse it came from. Held back by two things: only five of seven leverage points became dimensions, and the environment still has no institutional voice in any option; and everything rests on a single structured method. Convergence (roughly 65%, up from 45%): 243 combinations were narrowed with a stricter consistency rule to 99, then to three families, with a documented test of whether they genuinely differ. Held back because the consistency ratings are model judgments, and because the three families were chosen for distinctness, not for strength. Decision Hierarchy (roughly 35%, up from 15%): dimension, variant and family are clearly structured, each family with its own logic, beneficiaries, burdens and weak spots. What is still missing is prioritization, and that is not Design’s task.
Sound Reasoning: n/a — not yet reached. Scenario Robustness can be scored once a decision exists to check.
Values & Trade-offs / Commitment: n/a — not yet reached.
The Workshop Canvas in the Starter Kit includes a morphological box template, the same kind of tool used in this article.
Take the methods with you
The Strategic Clarity Starter Kit gives you four tools from the framework behind these articles: a Self-Assessment, a Cognitive Bias Guide,
a SIT Quick Reference and a Workshop Canvas with templates
for framing, driver mapping and a morphological box. Free.
Working on a specific decision? Talk to me about it →
The book shows how options are built from parts rather than picked from a list. Chapter 4 (Generate Strategic Options) uses a morphological box for strategy development, and Chapter 6 (Design: Shaping Strategic Architecture) applies Systematic Inventive Thinking to the Novaria case. Both are in Strategic Clarity in a Fragmented World, available on Amazon.
© 2026 Dr. Tobias Adam · www.strategic-clarity.site